If you read my last piece, you’ll be aware that gold is my favourite battleground for numerous reasons. As a disclaimer I’m already short and I also own some GCZ5P 1150 strike puts. As the title suggests, the trade outlined herein is to trade vol outright.
Last July I went to the Drobny Macro Summer School Conference in NYC. My favourite trade at the time, one that I suggested at the conference, was to buy precious metals vol below 12 vol points and it preceded to trade up throughout the rest of 2014.

The trade was predicated on essentially the very same reasons I outline below. This post may provide some good insight into my process. Eventually these posts will become much less thorough as I don’t need to flesh out the fundamental narratives and there becomes less need to elucidate on my thinking.
IDEA
Type – Contingent: potential breakdown, potential vol expansion, potential catalyst in rates.
Fundamental Context – Gold is a story in decline, its failure to break higher has continued to impair expectations of the “believers” in a positive outlook. Meanwhile, despite the drama over the Drachma, gold has failed to stage a rally. All whilst the Fed looks ever closer to raising rates, with 6.71 months until the first rate hike indicated by markets.

A good friend tells me that “these are still doomsday prices”, expecting the mean reversion has much further to run. Further, the financialisation of commmodities markets as a result of the internet allowing every man and his dog to trade anything from home, means a huge build-up in positioning transpired through the zeroes. Coinciding with the meme that inflation was coming due to the Fed’s QE program. Gold was bid to outrageous levels and has since sold-off in similar fashion to historical bubble analogues. For further reading on the fundamentals, see Mark Dow’s blog.
Hypothesis – Gold looks set to break down and given that vol is compressed, we have the opportunity to play a mean reversion in the absolute level of vol. with the added benefit, that if the Fed raises rates during our trade horizon, it may be a catalyst for gold to collapse.
Timeframe – 4-5 months.
Trade – Buy a four month straddle on GCZ5.
PRICE ANALYSIS
Trends:
LT Trend – Strongly negative
Intermediate Trend – Negative
ST Trend – Negative

Price Levels:
I think of price as the outcome of a contest of ideas in markets and reflective of the strength of conviction to which traders believe in a given story. With this interpretation in mind, the charts tell the story.

1165, 1140 and 1130 are the key support levels, yet as we can see in the below chart, the range of support may be quite wide.

Regression:
Gold is sitting right in the middle of its regression channel which has been in play since the April 2013 selloff that occurred right after gold failed to stage a meaningful rally during the events of the Cyprus bailout in March 2013. I remember thinking at the time this essentially invalidated its supposed purpose as a financial hedge.

Selling on overbought conditions proved quite fruitful since, as gold continually made lower highs. This is a strategy worth following until this regime breaks in one direction or the other. As evidenced by the below (very basic and obviously cherry-picked) backtest.

Nevertheless, even this mean reverting price behaviour has been sufficient to see large spikes in gold vol, but a breakdown of the magnitude of 2013, perhaps on the Fed raising rates, could see a significant vol spike.
Implied Vol:
“The single best predictor of future increases of volatility is low historical volatility.” – Jamie Mai, HFMW
If we think of price as the function of a contest of ideas, then the inverse of volatility is the measure of participants’ confidence in those ideas. For this reason it is a particularly valuable insight into a given market for a behaviouralist.
The low in implied vol in 2008 is obviously some bad data which skews the statistics somewhat, but even at the 9th percentile, we can be confident we are buying vol cheap.

Looking at the XAUUSD vol for confirmation, we can see that over the last 10 years only 319 observations have been below the current level.

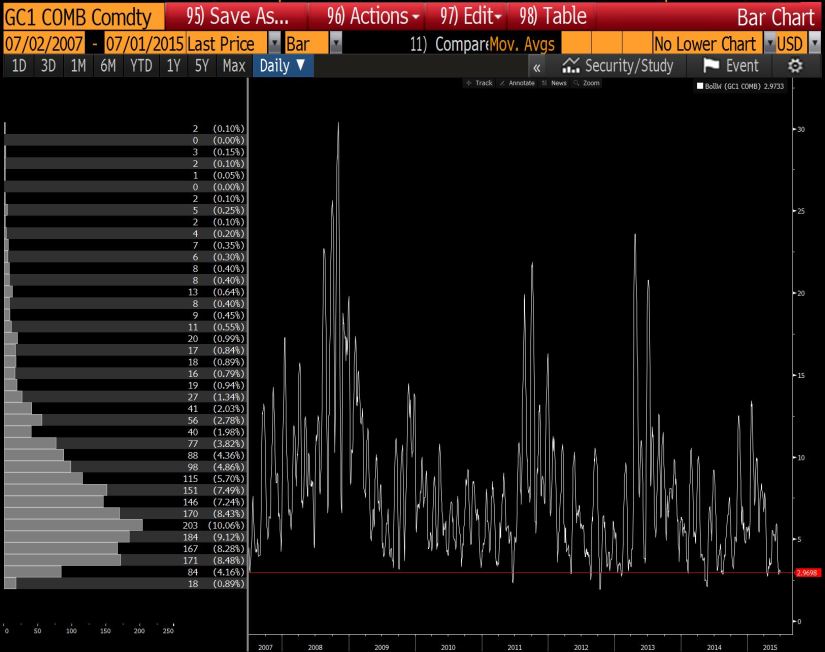
Bollinger Band Width:
As a technical proxy for vol, we can also see that Bollinger Band Width is particularly narrow. In the same vein as the Jamie Mai quote above, as a technical indicator, BBWidth is often used for a situation called “Tha Squeeze” whereby it often tends to contract before periods of high volatility.
Skew:
As we can see in the below skew, risk is to the downside.

Seasonality:
To gauge whether history is on our side, let’s look at vol seasonally. Most notable is the fact that August & September have the greatest average monthly positive changes.

Certainly if the 5 year average is anything to go by, July isn’t bad timing for entry.

EXPRESSION
Directionally speaking, as mentioned, my bias is to be short gold. If your strategy is to sell breakdowns, there may well be some interesting entries in the next few days. In terms of playing vol, we can either do it via delta-hedging an option or with an option structure.
Straddle:
Here is an indicative structure.

Payoff:
Obviously it’s path dependent, but presuming there are some good moves before expiry, delta hedging may well pay for the trade as implied vol here is only indicating a daily volatility of 0.95%. Below is the payoff chart if you hold til expiry without hedging along the way.

IN CONCLUSION
Due to the length of this piece I’m leaving out my expected value and position sizing process for a later post. Don’t do a trade like this if you don’t know how to size or manage it. I’ll likely hedge moves to the topside more aggressively given my directional bias is that gold goes lower.
Gold looks like it could break down tonight, so let’s see how this trade goes.
Please read the disclaimer.