The Common Law Premium | Buying the Pound Sterling

Dear readers, below is a piece that went out to members and friends of Prometheus Macro Research on the 12th of February. We hope you find it informative. Note that although the trade’s horizon is multi-year, we take into account some shorter-term considerations such as positioning and sentiment, for the purposes of developing a compelling argument for action, as well as to attempt to gain an additional edge from timing.


Universally, markets tend to ascribe a greater risk premium to political uncertainty than they will to its antithesis. So, perhaps there is a subtle irony that I would develop a compelling argument for action on the long side, coincident to the announcement that the British Parliament has authorised Prime Minister May to begin the process of invoking Article 50 of the Lisbon Treaty. A consequence of the vote to leave the European Union succeeding in the referendum on the 23rd of June 2016. A vote which left the freshly minted portmanteau ‘Brexit’, indelibly imprinted upon the popular lexicon.

BEHAVIOURAL CONTEXT

I’ve written before about the implications of ideology in speculative and investment decision making in Biases in Trading, where I made the case that through an evolutionary tendency toward emotional reasoning and various other fallacies and biases, people are predisposed to mistakes when making trading decisions according to their underlying political ideology. Indeed, perhaps this is why I didn’t fully exploit the fall in the Sterling whilst I was confident the ‘leave’ vote would prevail. A lesson which reminds me to focus on expected value and the potential asymmetries of political outcomes.

Politically, I leant toward Brexit, yet I didn’t appreciate that the outcome of its triumph would be so significant in the Pound over the short-term. Nevertheless, with new information and the iconoclastic tendency to question ideas that to others might be sacrosanct; I am inclined to face the other way. As the politics of Britain leaving the European Union has unravelled, it has appeared to me the emotional fervour has been distinctly in the Remain camp. Thus, I contend it is rational to diverge from the crowd amidst this cynical frenzy, and instead embrace an opportunity.

FUNDAMENTAL­ CONTEXT

Let us consider, that to the many people around the world living in countries with a less well-entrenched rule of law – if at all – that presently the Pound represents an opportunity to buy a share in the common-law system at a steep discount. The assurance of the common law system, as well as the land rights and other liberties which come with it, is a significant factor in the robustness of the world’s most successful commercial economies. Similarly, as opposed to its counterparts in customary and religious law, common law underpins the geopolitical position of the countries who employ it, by attracting capital.

IMAGE 1: LEGAL SYSTEMS OF THE WORLD
1
Source: https://en.wikipedia.org/wiki/Common_law

It is no surprise then, that the 16% drop in the ‘cable’ since ‘Brexit’, puts the currency in value territory against the dollar on a Purchasing Power Parity (PPP) basis; as evidenced in the chart below provided by one of our members at The Macro Trader.

CHART 1: GBPUSD PPP Valuation with 20% Bands
2

HYPOTHESIS & TIME HORIZON

Given our behavioural, statistical and technical reasoning, then temporally speaking the British Pound is likely to be near a multi-year cyclical bottom.

TECHNICALS

The British Pound trade-weighted index is approximately in the 3rd percentile of observations over the past 17 years as evidenced below.

 CHART 2: STERLING TRADE-WEIGHTED INDEX (TWI BPSP Index)
3

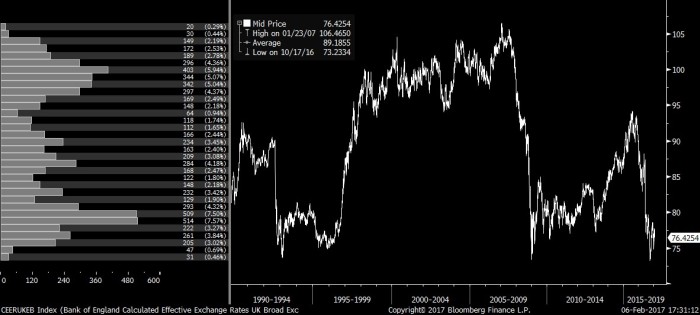
Whilst, the BOE Calculated Effective Exchange Rates UK Broad Index is presently in approximately the 4th percentile of observations since 1990.

CHART 3: STERLING TRADE-WEIGHTED INDEX (CEERUKEB Index)
4

Given these compelling statistical inferences, one must then consider the relative fundamental and technical characteristics of the Pound against various currencies.

GBPUSD

Technically speaking, the pound looks attractive on numerous fronts. The classicists are focusing on what many regard as a potential “double-bottom” pattern, indicated in red below, although a channel may be the more likely interpretation.

CHART 4: GBPUSD Daily with 200MA in Blue
5

Further, on the weekly chart the cable is resting and potentially bouncing-off long-term trend support. From an elementary statistical standpoint, it is not unreasonable to anticipate a move toward the mean of the histogram on the left axis, which is why statistical extremes with support, such as these, are appealing. Particularly, considering it is currently within the 2nd percentile of observations since 1993.

CHART 5: GBP Weekly
6

Of course, currencies are priced relatively, thus other crosses need to be considered beyond simply the technical attractiveness vis-a-vis the dollar.

EURGBP

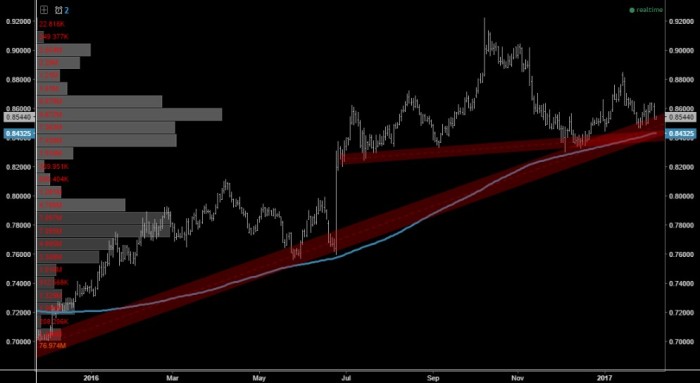
Similarly, on a daily basis, the euro-sterling appears to be a more compelling short, with a confluence of technical events occurring. Firstly, a seven-month head and shoulders pattern has the classical traders talking about a move which they measure down to the 74 handle. Further, the neckline of this chart happens to converge with both the 200-day moving average and an uptrend line that has held on the pair since it bottomed in late 2015.

CHART 6: EURGBP Daily with 200MA in Blue
7

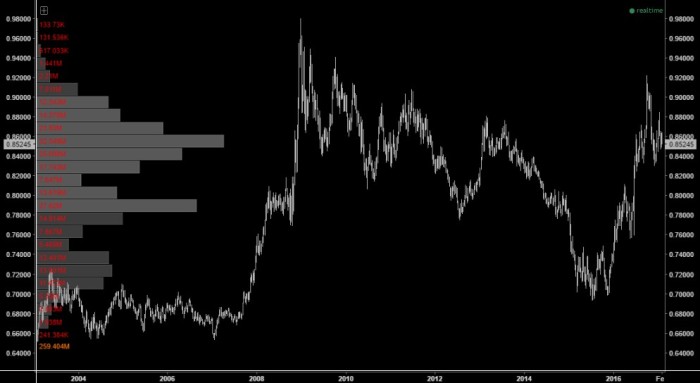
Turning to the weekly, the cross doesn’t yield too much in terms of a constructive technical insight. Although, fundamentally speaking the euro seems like an ideal candidate to express this trade as the political uncertainty baton has now been passed from the United Kingdom to the European Union, whose fragility is far greater without the Brits as a member state. Indeed, this is heightened by the risks posed by the various European elections this year.

CHART 7: EURGBP Weekly
8

GBPJPY

The short term chart appears to have potentially bottomed and reversed trend, given the price looks to have almost cleared the 200 day moving average. Albeit, there is little else technically compelling about the cross in the short-term charts.

CHART 8: GBPJPY Daily with 200MA in Blue
9

However, one constructive observation is the long term support against the Yen which has held since the mid-nineties. Perhaps one’s view of whether Abenomics will devalue the Yen would be the dominant factor in deciding the Sterling-Yen cross is the best expression.

CHART 9: GBPJPY Weekly
10

Indeed, further consideration must be given to the regime of a given market and whether it fits with one’s strategy. In the case of sterling-yen, it is traditionally a great cross to trend follow as evidenced overleaf.

Our weekly trend-following model recently signalled a buy on the cross. As mentioned, historically this strategy works favourably, going back to the beginning of our data in mid-1975. Certainly, it is a somewhat cherry-picked, lowbrow observation and whilst it is important to avoid over-fitting to the past, one must also consider the particular characteristics of a given market.

CHART 10: GBPJPY Weekly Trend Following Model
11

Whilst we don’t follow this systematically, it does provide meaningful insight into the probabilities of the approach one might take on the sterling-yen cross.

CHART 11: GBPJPY Weekly Trend Following Model Performance Summary
12

­­

POSITIONING & SENTIMENT

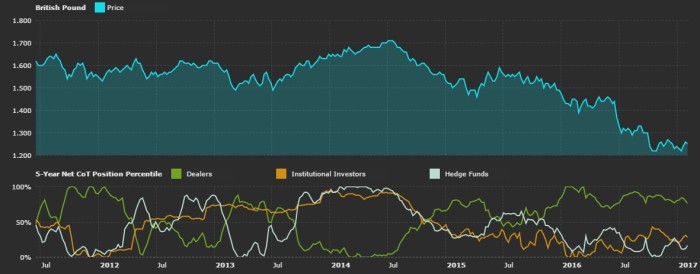
Positioning data for spot foreign exchange transactions is not available (hopefully one day), however we can look at the futures non-commercial positioning in the Sterling as a proxy. Notably, it is presently at relatively extreme levels vis-a-vis history.­­ In fact, the levels are nearing the extremes set in 2013 when speculators and hedge funds were almost unanimously bearish, and wrong.

CHART 12: GBPUSD Weekly & COT Net Non-Commercials Speculative Positioning
13

As a behaviourist, one must consider that positioning is a real-time referenda on financial speculators’ sentiment, which evidenced by short positioning reaching the same extreme levels as 2013, is extremely bearish. Hence, we are inclined to take the other side.

CHART 13: GBPUSD Weekly & COT Non-Commercial Shorts Positioning
14

­One of our members brought to our attention that these numbers must be adjusted for Open Interest, which he has done and ranked by percentiles on his site freecotdata.com. Presently, hedge fund positioning is in the 17th percentile, having recently increased from the lowest decile.

CHART 14: GBPUSD & COT Positioning Adjusted for Open Interest
15

VOLATILITY SURFACE

The GBPUSD volatility surface indicates market makers are more willing to write calls than puts presently. Rephrased and inverted, that means there is more demand to hedge via puts than calls. Suggesting that the market’s intersubjective probability assessment – or collective agreement of the Sterling’s future pricing – is fairly bearish. Consistent with our inferences from positioning data regarding the market’s sentiment.

CHART 15:  GBPUSD Volatility Surface
16

Further, this skew indicates selling downside structures to the hedgers may be of interest, so we shall turn our attention to implied volatility overleaf.

IMPLIED VOLATILITY

GBPUSD one month implied volatility is presently quoted in approximately the 89th percentile of the last 5 years’ data, as evidenced by the chart below.

­

CHART 16:  GBPUSD Implied Volatility
17

These implied volatility levels are invariably elevated as a function of the grey swan-like impact of Brexit. Arguably, they price a measure of recency bias given the likelihood of another ~14 sigma daily move is low, which fits with my unpretentious observation that markets ascribe a greater risk premium to political uncertainty than to its antithesis.

This view justifies the perspective that both implied volatility and realised volatility will revert toward the mean as markets re-calibrate to a more certain political reality, in a market where the weak hands have been shaken out due to such high realised volatility.

Simply put, less fragile positions reduce the probability of high realised volatility. However, this is not to suggest exposure to unlimited loss structures is ever prudent. Instead, loss-limited structures, such as short put spreads; enable the ability to collect this elevated risk premium with a pre-defined and limited loss. Similarly, for those who trade esoteric structures, selling one-touch puts provides a similar return profile to put spreads as they are loss-limited, non-recourse structures.

EXPRESSION & STRATEGY

Long: GBPUSD & GBPJPY (trend following)

Short: EURGBP

Derivatives: short gamma GBPUSD can add carry to the position

Rates: cheapen VaR by receiving LZ17

Equities: we shall follow up with our equity views when the timing is right

Given we have a multi-year time horizon on the Sterling and a fundamentally bearish bias over a similar temporal horizon on the euro, a strategic long with no stop is our chosen methodology. With the sterling-yen, trend following is our chosen strategy given its historical efficacy.

Further, whilst we don’t take unlimited-loss short gamma positions, selling the downside on GBPUSD remains an attractive proposition, particularly taking into consideration the skew and richness of the implied volatility, as well as providing the opportunity to add carry to the position.

PROBABILITIES & POSITION SIZING

Typically our position sizing process is one shamelessly adopted from James Leitner of Falcon Management Corporation who was kind enough to share his Kelly Criterion or optimal leverage sizing process with some of the Drobny Global Advisors members along with the presentation The Evolution of a Macro Portfolio. However, given we haven’t yet expanded upon this methodology and our variant of its application – looking at frequentist and intersubjective probabilities, and the expectations gap between them – for the purposes of keeping this piece as concise as possible we will leave this to a later date. Further, given a 100% allocation to a single currency exposure ­is everyone’s default position, sizing strategic long-term currency positions requires a somewhat different process to the one we would otherwise undertake for other asset classes. Of the various approaches one might employ, a risk-targeted approach is what we shall adopt. Accordingly, it is necessary for those who implement this trade to size according to their own risk tolerance. We shall follow up with an explanation of our sizing methodology and an introduction to our macro tracking portfolio in the coming days.


Best,
Carl Hodson-Thomas

Nb. For those of you interested in learning more about receiving our research, please visit http://www.prometheus-am.com.au/subscribe/

Biases in Trading: The Neuropsychological Contest of Emotion and Logic

The following piece is quite formal. Before I start sharing trades and analysis on this blog I wanted to provide an insight into my interpretation of behavioural macro trading. In which case I won’t have to unnecessarily elaborate when I work through my process in later posts. Apologies if this is TL;DR.


“Once we realize that imperfect understanding is the human condition there is no shame in being wrong, only in failing to correct our mistakes.” – George Soros

Contents:
1) Logic, Emotion and their Biologies
2) Dual Process Reasoning
3) Shortcuts to Fallibility
4) Anatomy of the Gold Bug
5) Emotion Drives Cycles in Trading
6) In Closing
7) Further Reading

Logic, Emotion and their Biologies

“Reason is, and ought only to be the slave of the passions” – David Hume

Our brains are in constant disharmony, a contest between two conflicting forces. The first force is emotion. Emotion, can be both wondrous and destructive. Primarily because it is a characteristically primal, subjective and intrinsically hard-wired system that operates on an intuitive autopilot. The second force, logic, is less primal in nature due to its extrinsic abstract qualities and typically requires purposeful effort in order to reason objectively.

These two forces are asynchronous and so, remain in perpetual disunity, with one often contradicting the other,  e.g. the platitude “my head says one thing, my heart another”.

Even when we attempt to reason as objectively as possible, emotion interferes in the process, resulting in an outcome intertwined with our instinctive emotional biases. Hence, this inherent predisposition to faulty reasoning – to be a slave to our passions – our fallibility; was regarded as the manipulative function by George Soros. Nb. Not only do we manipulate reality, but also our understanding of it.

Neurologically speaking, the Neocortex, the part of the brain considered responsible for objective decision making; cannot reason without being influenced by the Amygdala, considered responsible for subjective emotional function.

The Amygdala is given priority in the brain over the Neocortex. As a result, one’s opinion tends to feel in an ill-reasoned, preconceived manner that was likely subsconsciously, and then consciously; constructed long before it was considered rationally. A curious function from an evolutionary biology perspective of our lizard brain attempting to keep us out of danger.

As information comes in, our subjective emotion is constantly undermining and contaminating our process of reason. This reflexive propensity influences all people differently.

Yet, this is only the beginning of how we fail to logically reason.

Nb. I’ve left out the discussion on hormonal effects on cognition and behaviour as it’s worth its own post entirely. Check out John Coates book linked below in Further Reading to jump start on the topic.

Dual Process Reasoning

In Thinking Fast and Slow, the eminent psychologist Daniel Kahneman separates how we process information into two systems. We have an instantaneous, intuitive and instinctive System 1, and a deliberate cognitive system, which is (hopefully) logical and rational, System 2.

System 1 is automatic, stereotypic and subconscious. It is no surprise then that it’s function is most closely associated with the Amygdala.

System 2 is the one we call upon for problem solving and strategic thinking, it requires a lot of energy via concentration. Depending on one’s familiarity with the problem at hand, System 2 takes a conscious effort to recruit, thus straining our finite capacity for logical effort.

Due to the effortful nature of System 2 and a finite capacity for abstract logic, we tend to take shortcuts. It’s hypothesised this is due to our reasoning faculties being a more recent evolutionary adaptation. Nevertheless, what we do know is the shortcuts we take. By being aware of these shortcuts and giving them a taxonomy, perhaps we can (hopefully) better recognise them in others, and, even better, give ourselves the tools to introspectively critique our own reasoning.

Shortcuts to Fallibility

Now we’ve covered the neuropsychological conditions which make us prone to failures in our reasoning, let’s look at some of the tendencies which result in the human brain drawing incorrect conclusions.

Cognitive biases are patterns in perceptual distortion that are replicable and responsible for misjudgement and illogical observation. There’s a vast array of examples for these spanning both human interaction (social biases) and judgement (memory and decision making biases). Cognitive biases arise when emotion, coupled with the rapid-fire nature of the lizard brain; result in heuristics applied outside the bounds of reason. Biases in professional trading and investing have been well documented since Keynes’ beauty contest and they are worthy of an entire tome themselves, so I only gloss over some key ones in this piece with the below examples.

H/t ritzholz.com
Cognitive Biases
Source:  Royal Society of Account Planning

Logical fallacies are errors in logic, they can be formal violations of propositional logic or informal fallacies whose content or argument requires a leap in logic, leaving a disconnect between one’s premise and resulting conclusion. Most commonly these are inappropriate generalisations. Another great graphic with some examples below.

FallaciesPoster
Source: Yourlogicalfallacyis.com 

Reasoning by association, substitution or analogy, is an example of an inappropriate generalisation, a mistake humans often employ to shortcut the effortful process of recruiting System 2. When we find a false equivalency, we rather conveniently do not have to distill a problem to its first principles and reason out from there. Instead we are trusting the logic of the analogy; something that works well in our memory, which is typically associative, but less so in logical propositions.

An axiom is a starting point for a logical proposition, generally so evident that it is presumed true without skeptical inquiry. Axiomatic thinking is valuable when one has successfully identified a first principle, but disastrous when patently false. e.g. The Fed’s monetary policy will lead to inflation. In this false axiom, there’s a substitution between a bias about a contingent event, with an objective first principle; invariably perceiving it as given. i.e. Given A then B.

It is no surprise then, that this was likely undertaken in an attempt to reason quicker and probably done emotively and subconciously before being rationally considered by System 2. A curious commonality in these types of misjudgements is that they generally stem from an ideology, be it political, economic or religious; all are likely to incite and galvanize emotion.

“At the time, I was politically right wing and that fit with being an inflation-alarmist. The theory that the evil government was constantly debasing the currency provided for the perfect perspective for trading the inflationary markets of the mid-1970s.” – Michael Marcus, Market Wizards

Michael Marcus’ quote above is a pertinent example of one’s political ideology impacting their decision making. In investing and trading this can be both help and hindrance.

I’ve included a small survey out of curiosity to see if Michael Marcus’ observation held true in recent beliefs about the outcome of Quantitative Easing (QE). The hypothesis being: is the right more prone to an inflationist belief because of a political ideology espousing smaller government? Please check the box which best describes you. I’m Australian so forgive me if this seems a little politically insensitive.

In this way, we can ascribe a typology to ideas held by market participants and treat these ideal type generalisations as hypotheses when making investment decisions of our own. By considering sentiment and psychology and working out which story, or ideal type is the most powerful in the contest between bulls and bears, as traders we are better equipped to handle the pendular swing of sentiment and positioning in markets, such that we may have a better chance to predict and profit from the dynamic price movements and volatility in financial markets.

Giving these hypotheses the treatment of scientific falsification, we prevent ourselves from making the mistake of getting wedded to false axioms.

Anatomy of the Gold Bug

“Gold is the only commodity where the amount of supply is literally about 100 times as much as the amount physically used in any year. That is not true of any other commodity, such as wheat or copper, where total supply and annual consumption are much closer in balance, and true shortages can develop. There is never any shortage of gold. So gold’s value is entirely dependent on psychology or those fundamentals that drive psychology. Many years ago, when I was a commodity research director, I would totally ignore gold production and consumption in analyzing the market. I would base any price expectation entirely on such factors as inflation and the value of the dollar because those are the factors that drive psychology.” – Jack Schwager, Hedge Fund Market Wizards

The anatomy of the gold bug is the home-ground for behavioural macro analysis. As noted by Jack Schwager, given that gold is the only commodity whose supply is completely unrelated to the amount physically used there is no rational economically derived fundamental logic to explain the price movements in the commodity, it is simply a function of what people are willing to pay and that is determined by their expectations, which are likely biased by their political and economic ideology and emotion.

The antidote is to consider gold mechanistically; in terms of the market’s positioning, and behaviourally; in terms of sentiment, story and expectations. Sadly, this is not what happens in practice. Logic is suspended as participants are influenced by their axiomatic beliefs. The right wing guy with the house in the country who owns guns and gold and is fearful of big government and inflation, as an extension of the Michael Marcus archetype; takes it as a given that inflation will be created by the profligate government without questioning the fundamental logic of that axiom. Instead, he’s thinking about something which is contingent as though it is a given and not distilling the observation to first principles… because it was easier to skip that part.

Emotion Drives Cycles in Trading

“Faced with the choice between changing one’s mind and proving that there is no need to do so, almost everybody gets busy on the proof.” – John Kenneth Galbraith

You will come across many professional traders who will point out the disparity between paper trading and the real thing, this is because when paper trading you haven’t had the market test your nerve. That’s before accounting for the emotional difficulty one may face when it comes to changing one’s mind.

Consider the generic chart for gold below. This chart represents one of the greatest displays of emotions in trading. Indeed anyone who trades derivatives or understands the Greeks knows that it’s more complex than simply buyers and sellers. However, resistance and support keep occurring in the same ranges outlined in red for a reason, as Mark Dow smartly put it: “the behaviour behind resistance, of course, is the old I’ll-sell-it-when-it-gets-back-to-where-I-bought-it”, or vice versa.

gc1

Indeed, we can see how emotion is driving this process. For example, imagine your bias is to be bearish – you are more confident that you are correct when reality, read price, accords with your thesis, and conversely, less confident when it looks to be challenging resistance and doesn’t confirm your thesis. If you try to short gold when it makes a new low and it fails to break down, you stop out of your position as your fear response kicks in and the Amygdala or System 1, overrules the logic that justified your trade. Thus, there’s an upward force on price and the continuum of reflexive feedback between price and conviction continues.

Similarly, the bulls begin to develop confidence when the price appears to be breaking higher, and when it fails, their System 1 interferes and they hit their stops, and the process repeats. This occurs across various macro horizons. Above we can see it occurring in the course of months, but it also transpires in every timeframe, from intraday moves to the course of years. For example, take gold’s long slow march from its early 2000’s base, to its eventual sharp acceleration and blow off top. In longer term cycles, the pendular swing might be slower, and the bulls might have had the power for longer, but the process is still the same. Once the self-reinforcing positive feedback between price and participants behaviour is extinguished by the bubble bursting, the virtuous circularity becomes vicious.

GC1 lt

“Religion is a function of repetition and a passage of many many years. 10 years is effectively sufficient to create a cult, a cult of belief, in capital markets.” – Hugh Hendry

Ultimately, we can see the neuropsychological contest of emotion and logic not only occurs internally for market participants, but is also represented collectively through price action in markets, where we observe a contest of ideas represented by the participants willingness to risk capital on those ideas, reflective of their strength of conviction. The more people are convinced, the greater the emotional conviction, the stronger the idea and the more likely it is a meaningful move, or potentially, a bubble will develop. Most notably, it is often these illogical cult-like axiomatic beliefs which empower people to risk the most capital with the greatest conviction. Numerous newsletter writers on the internet, charging a $20p/m fee are incentivised to cater that, to paraphrase Kahneman: “A reliable way of making people believe in falsehoods is frequent repetition, because familiarity is not easily distinguished from truth”.

In Closing

Feedback allows us to update System 1, allowing us to develop skills, so that we are less prone to letting the Amygdala mislead us. This requires time, the effortful recruitment of System 2; and the ability to be introspective so that one is not allowing emotion to cloud their ability to remain objective. Dalio has tried to instill this within his culture at Bridgewater:

“I’ve learned that everyone makes mistakes and has weaknesses, and that one of the most important things that differentiates people is their approach to handling them. I learned that there is an incredible beauty to mistakes, because each mistake was probably a reflection of something that I was doing wrong, so if I could figure out what that was, I could learn how to be more successful.” – Ray Dalio

Ultimately, embracing mistakes and critical thinking (ex-ante and ex-post) are the only tonic to assist us with rationality. Nevertheless, it’s easier said than done, particularly in markets. Let’s see how you behave when you have your money on the line!


Further reading:
The Hour Between Dog and Wolf by John Coates
Thinking Fast & Slow by Daniel Kahneman
Behavioural Investing: A Practitioners Guide to Applying Behavioural Finance by James Montier


China, Iron Ore and a Future Bust

“The numerous misfortunes, which attend all conditions forbids us to grow insolent upon our present enjoyments… For the uncertain future is yet to come, with every possible variety of fortune.” 

– Solon’s Warning

CONTEXT: 

I am one of the very few Aussies who is concerned about the future of an industry, iron ore exports; which represent a large portion of Australia’s GDP. From a fundamental top-down perspective I concur with the Hugh Hendry/Jim Chanos observation that China is amidst a credit bubble and is running an unsustainable economic model. The Chinese steel sector would be unprofitable in 2012 based on Chanos’ forecasts, yet they continue to add more and more capacity to a decentralised steel sector which is directed by local municipal government employees so they can meet their GDP targets.

From Barrons (emboldened emphasis mine):

“China has an investment-driven model where they simply want to produce GDP growth. They can continue showing GDP growth, as long as there is credit to support that investment. The problem is that most of these investments, at this point, do not generate an economic return and haven’t for a while. So you have the dichotomy of a country growing its GDP but destroying wealth. I view it as a stock that’s rapidly growing, but whose earnings are below its cost of capital. Any finance professor would tell you that’s a company that is liquidating and going to run into the wall. That’s what China is doing. But it can go on for a while.”

Essentially, China responded to the financial crisis with a massive stimulus via credit expansion in 2009.  From a historical standpoint, this was the single largest monetary expansion as a percentage of GDP ever undertaken.

CHINA M1:

China M1

CHINA M2:

China M2

With the CCP’s politburo aggressively directing the economy from on high and trying to stimulate growth via incentivising construction, massive overcapacity was inevitable.  Most notable examples: construction (property developers, cement makers), steelmakers (steel companies, iron ore miners, coking coal miners), shipping (ship builders) – all suitable industries to be short when the timing is right. This view is my fundamental bias, albeit I am agnostic to timing.

Below are a couple of videos on the Chinese real estate over-construction/overcapacity problem, the first which aired on Dateline in 2011 gives some insight into the idle-capacity which represents the liabilities side of China’s balance sheet, the second by Stratfor gives a more recent look at the policy implications and the difficulty the CCP are having in maintaining growth, whilst increasing the standard of living and attempting to convert from a investment-led growth model to a consumption-led one.

In order to monitor the fundamentals on the ground in China there are two main considerations, 1) policy (which I will be monitoring going forwards) and; 2) Shanghai rebar (short for reinforcing steel) is essentially the secondary market of iron ore and is the best proxy to Chinese domestic demand.

SHANGHAI REBAR INVENTORY:

Shanghai Rebar Inventory

SHANGHAI REBAR PRICE:

Shanghai Rebar Price

IRON ORE:

Iron Ore

Today, iron ore prices are reflecting the positively bullish assessment of global growth (read Chinese) demonstrated by equity markets. Early last year I spoke with World Steel Dynamics, who reinforced my bearish bias with a view based on their brilliant research that Iron Ore would sell off by July and they were very nearly correct with timing and their target price level. So I will look to discuss with them again in the near future what their views are for 2013.

From the information we do have however, we can see that Iron Ore is leading rebar, this divergence would (normally) encourage me to look for an entry to be short once rebar falls over, however, 93 mines have been shut down in India due judicial activism which may have contributed to short-term supply constraints.

Shanghair rebar and Iron Ore

CORRELATION – Iron Ore & Shanghai Rebar:

Iron ore and Shanghai rebar are usually fairly tightly correlated as we can see below, yet they have diverged to the 99.59th percentile over the last 12 months’ spread – perhaps this is due to a disparity between on the ground demand in China and iron ore prices reacting to a supply squeeze out of India?

Shanghai Rebar Iron Ore Correlation

All things being equal, I anticipate a continued short-term global economic rally, however, one thing we can be certain of is that the underlying reality will again rear its ugly head and demonstrate that Iron Ore demand is not as significant as many companies have bet. The largest bet by an Iron Ore producer on this demand is that of FMG with a total debt to equity ratio for FY2012 of 2.26x.

FMG’s expansion plans have eclipsed targets of 95Mtpa for FY2013, with an annualised Dec12 run rate forecasting a possible 100Mtpa, with an ultimate target of 155Mtpa.

CORRELATION – FMG & Iron Ore:

FMG and Iron Ore are very tightly correlated at the moment, given FMG’s highly levered bet on the price of Iron Ore, its fate is invariably sealed to the price staying above $90/t for the next 2 years (I will get to this in my next post) – making the future of FMG very binary.

Correlation Iron Ore FMG

TECHNICAL ANALYSIS: 

FMG is in a long term down trend since it hit a post financial crisis high in January 2011, the key resistance line since that time is drawn in below and FMG has continued to sell off on approach to this trend line. However, given Iron Ore prices are nearing $150/t and FMG is running a potential 100Mtpa, one must assume FMG’s equity price will advance on Iron Ore prices at this level and break out through this trend line.

FMG trendline

FMG is testing some very important price levels at $5.04 which is a key resistance level, I suspect it will roll over slightly from here and bounce off support at $4.67 to rally and break out through the resistance at $5.04. Thereafter, $5.50 and $6 are the key resistance levels. Between these price levels I anticipate FMG’s price action to encounter resistance, at which point I will look to pull the trigger on my bearish positions: short the equity and long OTM puts at previous key price levels of $3.50 and $4. 

FMG resistance breakout

FMG IMPLIED VOLATILITY:

Implied volatility, which is the market’s best estimation of future price volatility and hence an input into option price models; often falls during rallies, which provides an opportunity to take an option position with an increased probability of making a profit. Nb. the longer the timeframe the higher the likelihood volatility will mean revert. In this case I will look to pull the trigger on the put positions with different tenors (I hope to outline for you in the future) as well as a buy a long-dated strangle, to express a view on FMGs binary future, as well as to take advantage of the flaws in normal distributions – an inability to accurately gauge the probability of future price trends that are deemed improbable by the pricing model.

Implied volatility is a key caveat when I enter options positions, if implied vol is high (which I like to think of as a price) it means I am paying more for my options, and less likely to expire in the money from a probabilistic standpoint. Typically I like to buy volatility in the quantiles, near long-term lows – areas where I am comfortable the Implied is near a floor. If we look at implied volatility below, we can see it is heading towards April 2012’s lows in the low 30’s – remember, low volatility is the single best predictor of higher future volatility.

Implied Vol

Implied Skew Steepness

EXPLOITING OPTIONS MODELS:

A normal distribution, the mathematical basis for options pricing models imply future prices are more likely to be near the current level, while probabilities decrease significantly for prices further OTM from current levels.

Standard_deviation_diagram.svg

However, I think the reality for FMG is a fairly bimodal distribution, something more like this:

bimodal

If this is the case, regardless of my bearish view on FMG’s future, we can de-risk our directional view, expend a small amount of premium and buy a long-dated strangle – this position could have some potentially large upside when FMG’s price moves to acknowledge that Forrest/Power have either succeeded or failed… We will find out in the next 9-18 months.
In the meantime lets keep our fingers crossed FMG’s Implied Volatility falls and it rallies to $6, so we can make the bet!

Enjoy your weekend,

Carl